TerraIndex™ HPI – A Robust Solution For Rapidly Changing Markets
BELLEVUE, WA – Pivotal shifts in the first quarter of 2023 highlight the need for more timely reporting on housing markets. Are prices still declining or increasing? Three California metropolitan statistical areas (MSAs) tell a compelling story.
What happened is now clear. After a lengthy free fall that started in the summer of 2022, house prices in California’s top MSAs suddenly hit an inflection point in January and February this year and started rising again. But when did we know it happened?
While the leading national HPI indices generally agree on price trends for many states and MSAs, when they report that information is getting more attention these days as rapidly changing markets require more timely reporting.
Perhaps nowhere was this more evident than what happened in the Los Angeles, San Francisco and San Diego housing markets in the first quarter. Based on HPI reporting by Case-Shiller and Quantarium, the charts below show the inflection point that occurred between January and February 2023 for these three top MSAs in California.
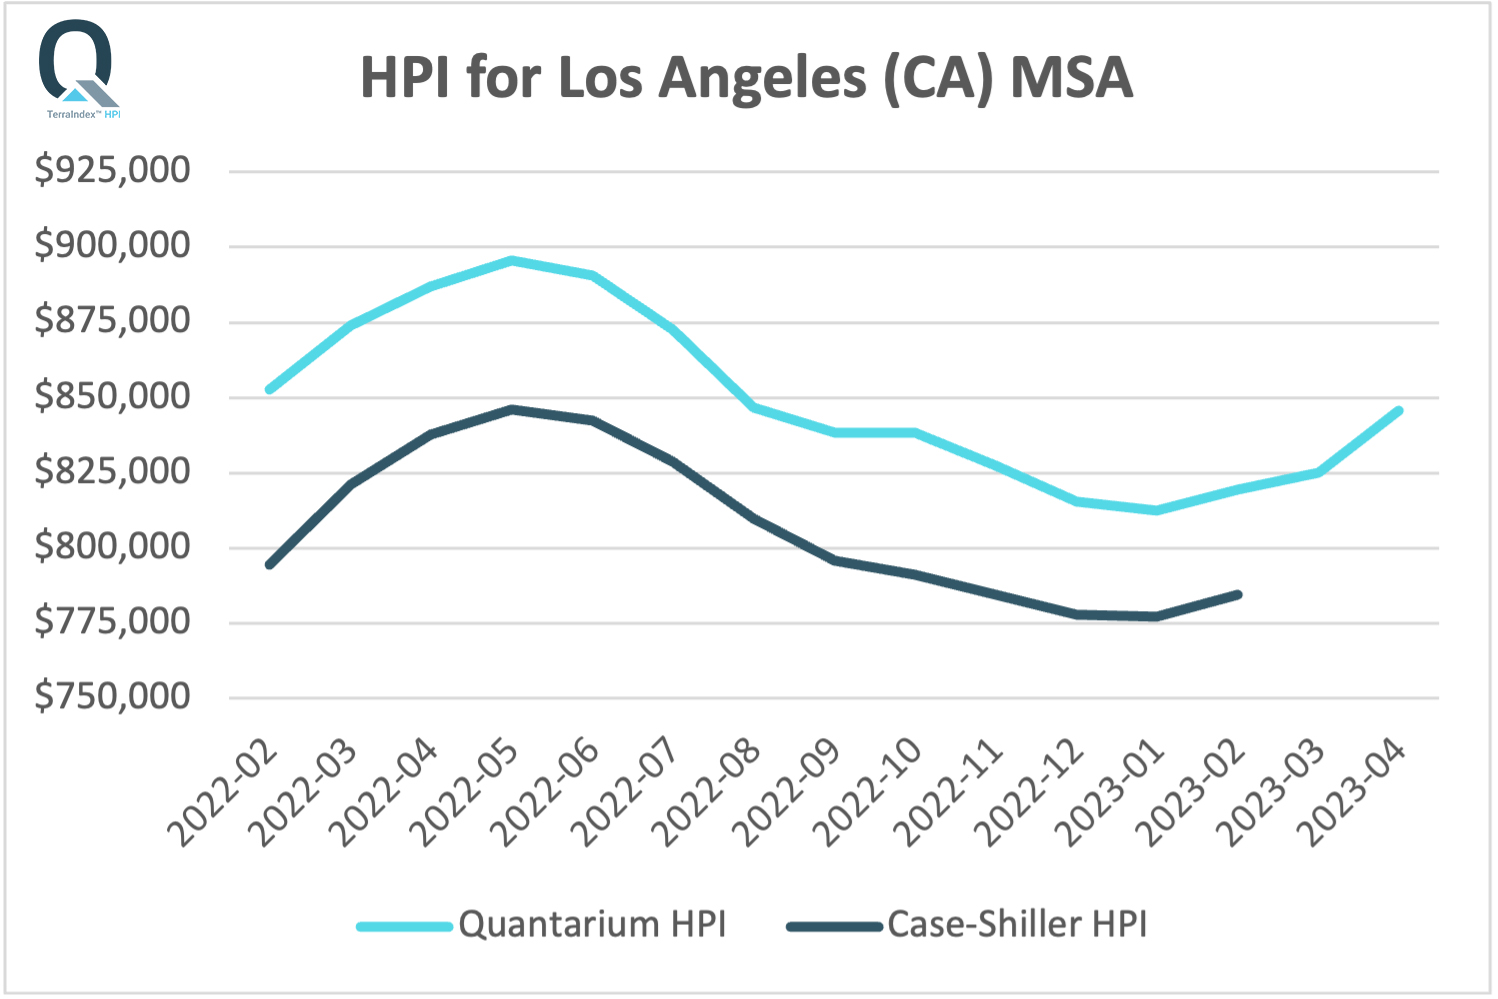
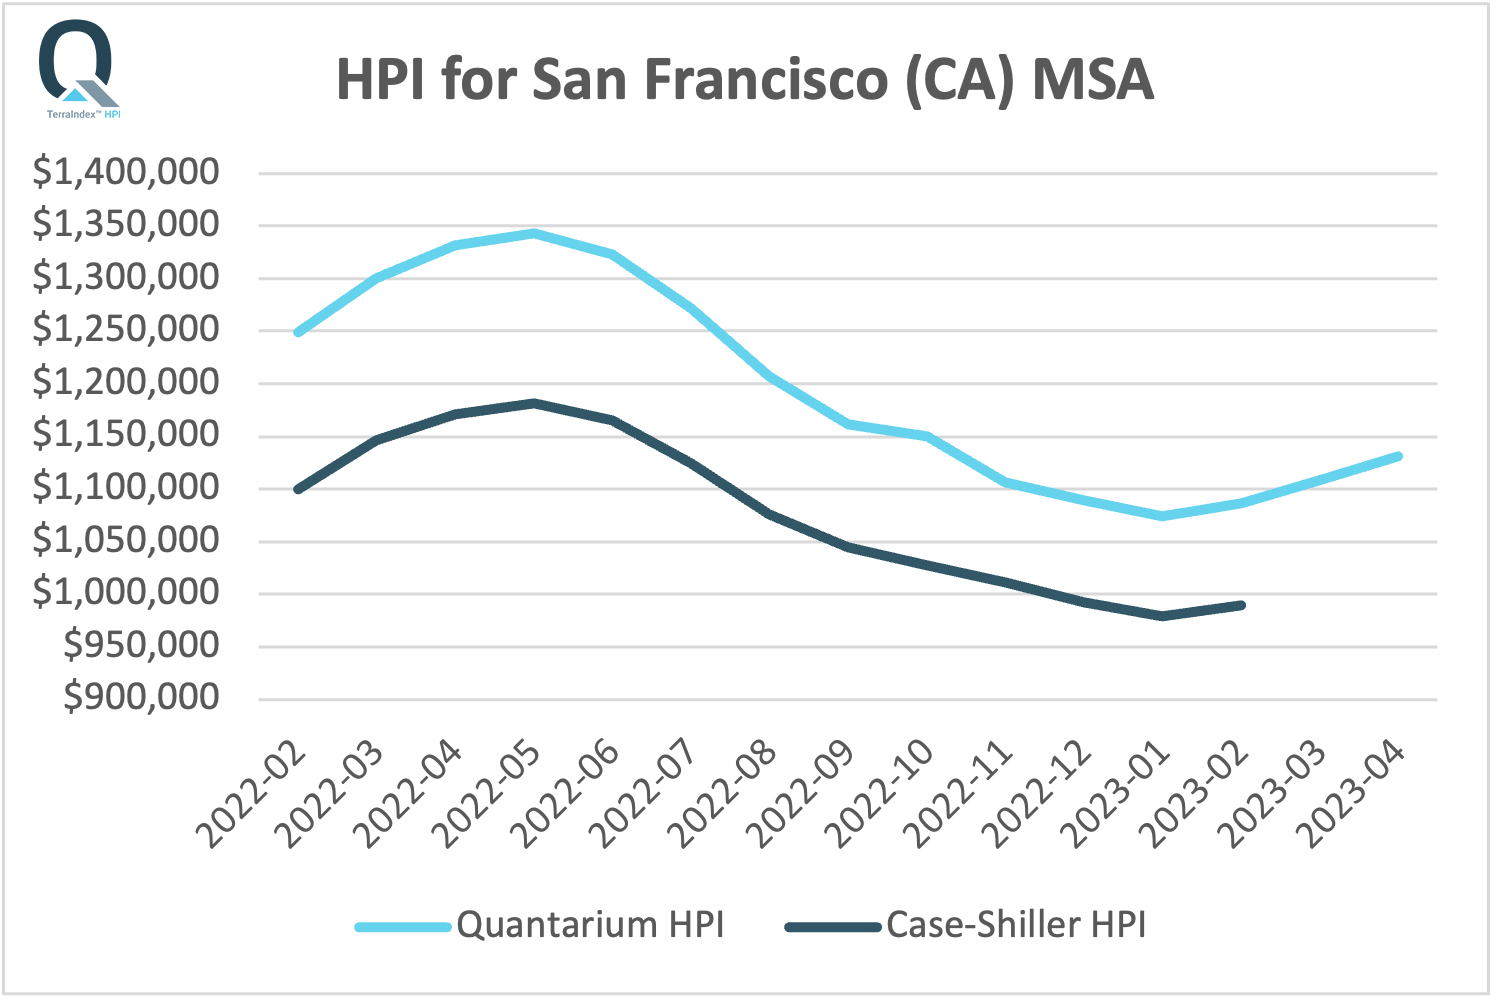
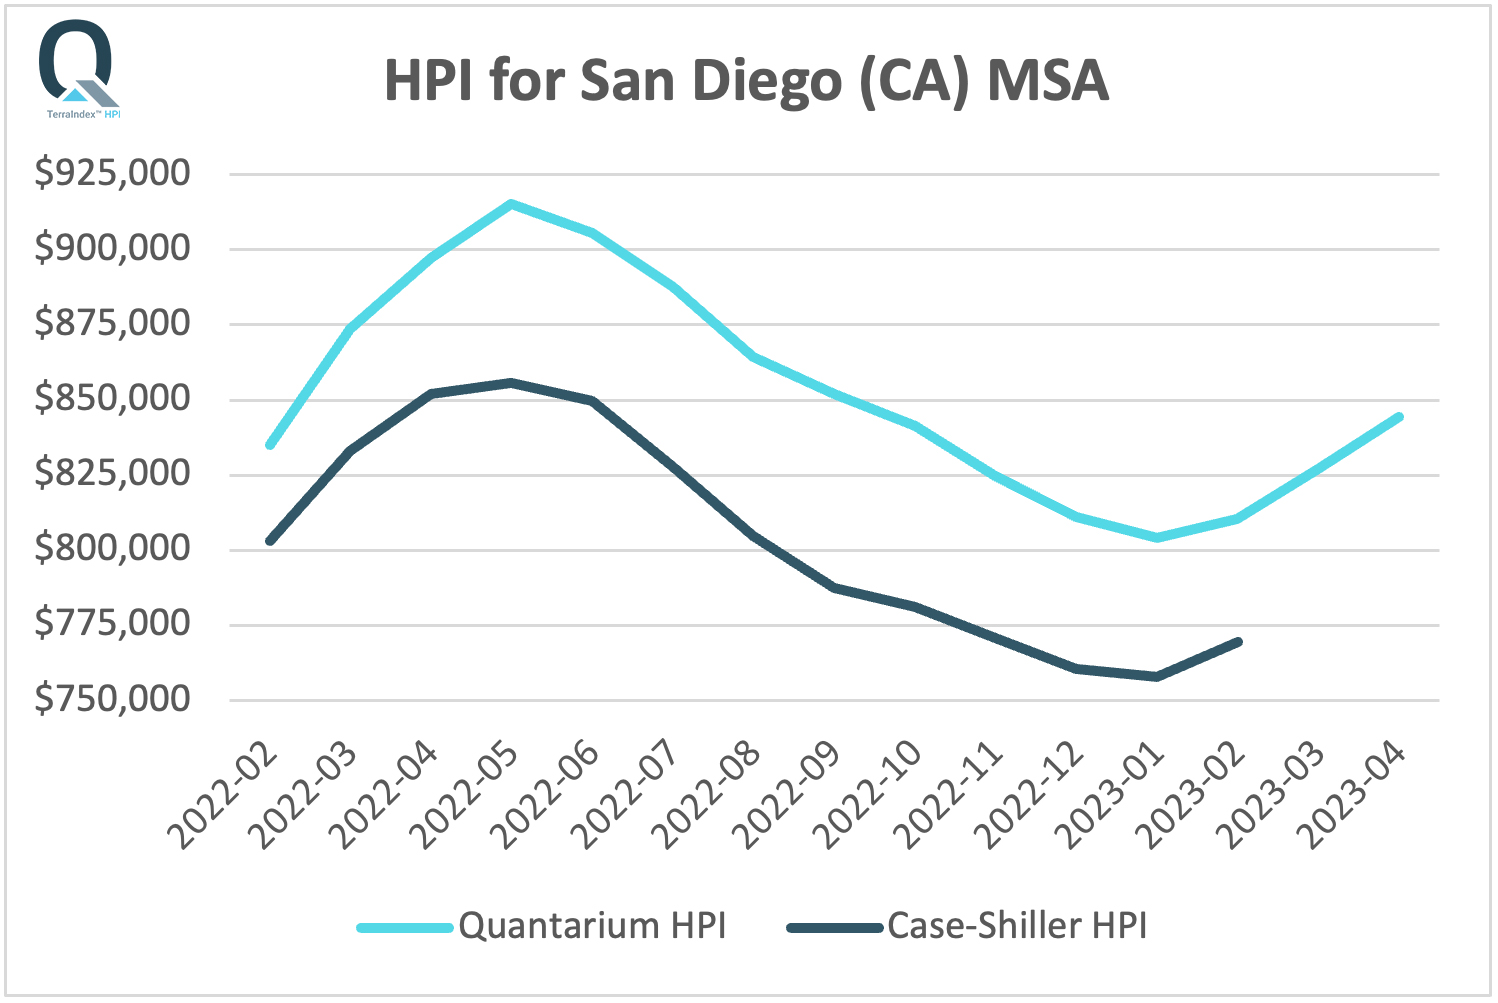
Note: the Case-Shiller HPIs were adjusted by a fixed multiplier in order to fit the same chart scale, without any impact to the actual trend line.
Followers of Quantarium’s TerraIndex™ HPI Report for February 2023 were the first to receive and understand these market insights on March 8th – just eight days after the end of the month, showing users that significant month-over-month increases in these western MSAs had replaced a seven-month long depreciation trend. Case Shiller HPI users had to wait until April 25th, almost seven weeks later, to get the same information.
At the time of this article, Quantarium has already published its March and April 2023 HPI reports, two months beyond Case-Shiller’s latest available HPI report for February 2023. Quantarium’s March and April 2023 HPIs again show additional month-over-month price increases for these western markets, clearly confirming the market trend shift.
Additionally, these reporting time advantages occur on a national basis. Quantarium has reported that 58% of the top 50 core-based statistical areas (CBSAs) recorded non-seasonally-adjusted month-over-month home value increases in February 2023. This is a stark increase from January 2023, when that percentage stood at 14%, and December 2022, when essentially no top 50 CBSA exhibited meaningful month-over-month home values appreciation, a continuation of the zero-growth trend reported for the entirety of Q4 2022. As a matter of fact, the Case-Shiller HPI reports for October-December 2022 are consistent with Quantarium’s HPIs, with none of the top 20 MSAs reported on showing any non-seasonally-adjusted monthly price appreciation. Time is money and an essential difference and compelling advantage for TerraIndex™ HPI customers is having key market insights delivered seven weeks prior to the Case-Shiller reports.
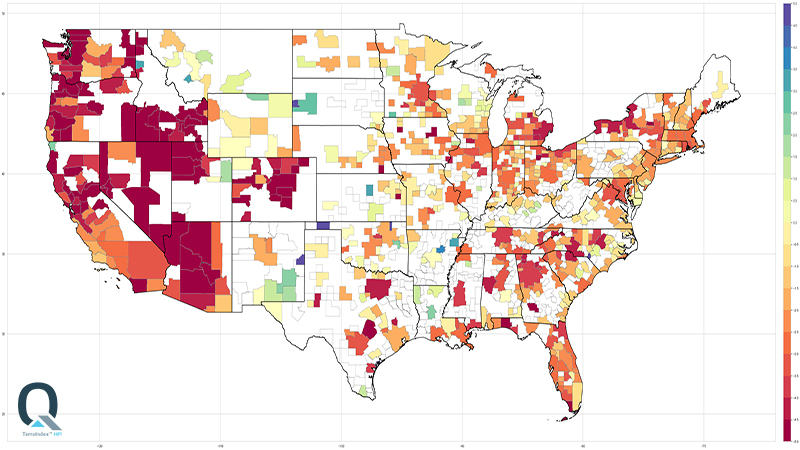
For a different and even more suggestive visual, one can look at the heatmap charts below, reflecting Quantarium’s HPI data for about 650 CBSAs nationwide over two consecutive calendar quarters, Q4 2022 and Q1 2023.
Quantarium HPI Changes by CBSA during Q4 2022
Quantarium HPI changes by CBSA during Q1 2023
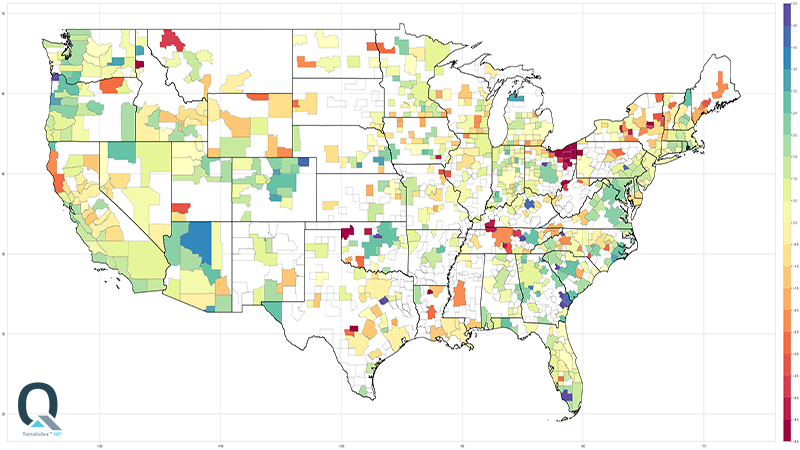
The market shift is clearly visible when comparing the two quarters, with a sharp contrast between the steep home value depreciation that occurred during Q4 2022 (the red shades) and the overall home value appreciation (the green shades) that started in February of Q1 2023.
“In the age of information and instant answers, it seems peculiar for one to wait almost two months in order to learn how home prices are doing today,” said John Smintina, Ph.D., Chief Analytics Officer and Quantarium Co-Founder. “In a rapidly changing housing market, time is often money, so a delay can be quite costly.”
Data Sources Used In This Report
For Quantarium HPI data – see corresponding monthly report from https://www.quantarium.com/terraindex-reports/. For example, the HPI data for the month of February 2023 can be reviewed from https://www.quantarium.com/terraindex-report-february-2023/.
For Case-Shiller HPI data – see https://www.spglobal.com/spdji/en/indices/indicators/sp-corelogic-case-shiller-us-national-home-price-nsa-index/#overview.
Historical data at MSA level is available from Federal Reserve Economic Data (FRED)- see https://fred.stlouisfed.org/release/tables?rid=199&eid=243576#snid=243577.
For CoreLogic HPI data – see the corresponding monthly report from https://www.corelogic.com/category/intelligence/reports/home-price-insights/. For example, the HPI data for the month of February 2023 can be reviewed from https://www.corelogic.com/intelligence/us-home-price-insights-april-2023/.
For Black Knight HPI data – see the corresponding monthly report from https://www.blackknightinc.com/data-reports/?report-type=mortgage-monitor&. For example, the HPI data for the month February 2023 can be reviewed on page 13 of the following PDF – https://www.blackknightinc.com/wp-content/uploads/2023/04/BKI_MM_FEB2023_Report.pdf?.
For Zillow HPI data – see https://www.zillow.com/home-values/102001/united-states/.
About TerraIndex™ HPI
The TerraIndex™ Home Price Index (HPI) is based on the proprietary Quantarium Valuation Model (QVM) value estimates for more than 100 million residential U.S. homes. QVM has been tested extensively in the last five years by some of the most trusted third-party AVM testing agencies in the U.S. and has been consistently ranked at the top for both Accuracy and Hit Rate performance metrics. QVM was also recently approved by Fitch Ratings for Wall Street transactions. You can read the announcement here.
QVM re-computes the estimated values for the entire national footprint on a weekly basis, along with HPIs at various geography levels – from State, County, CBSA, down to Zip Code and Census Tract. Furthermore, the HPIs produced on any given date are based on proprietary valuation models which include over 90% of all sales transactions that will have been eventually reported through a four-week rolling period ending that date, taking advantage of Quantarium’s industry leading Data Services Platform (QDSP) to reduce the processing time lag to an absolute minimum. That allows TerraIndex™ HPI to provide the most current market insights, being weeks faster than most other housing indices in the U.S.
The report for a given month is usually available on the second Wednesday of the following month. For example, HPIs for the month of April 2023 were released on Wednesday, May 10.
About Quantarium
Located in Bellevue, WA, Quantarium was founded by a team of leading scientists and Ph.D.’s. The company has designed and developed an innovative and enabling set of AI and Visual Technologies currently being deployed across multiple real estate industry sectors. Quantarium is one of the most accurate sources of property insights for over 158 million U.S. properties and trusted by major mortgage lenders, financial institutes, builders, direct marketing agencies, and real estate professionals across the nation. With a technology suite that is different in kind, then degree, the company’s products and services uncover and capitalize on the core DNA of vertical industries. From genetic modeling property valuations and markets that understand and interpret real estate data as expressed through synthetic future populations, through to CV adjusted values, Quantarium offers real AI to drive real value.
For more information, visit quantarium.com.
Business Inquiries for Quantarium:
+1 424 210 8847
discover@quantarium.com
Media Inquiries for Quantarium:
Romi Mahajan | KKM Group
+1 425 591 7664
romi@thekkmgroup.com
