TerraIndex™ HPI, released weeks ahead of competitors, shown to report similar trends
BELLEVUE, WA – Since Quantarium first began publishing its TerraIndex™ HPI more than three months ago, the results have shown that the company’s national HPI is returning results that are similar to other national HPIs – but a lot faster.
The TerraIndex™ HPI Report is like other national HPI-based reports that track house prices and trends, such as the Case–Shiller National Home Price Index and the Black Knight Mortgage Monitor Report. Along with the Zillow and the Core Logic indices, these approaches all use hundreds of millions of mortgage and public records and MLS data records as the foundation for their reports.
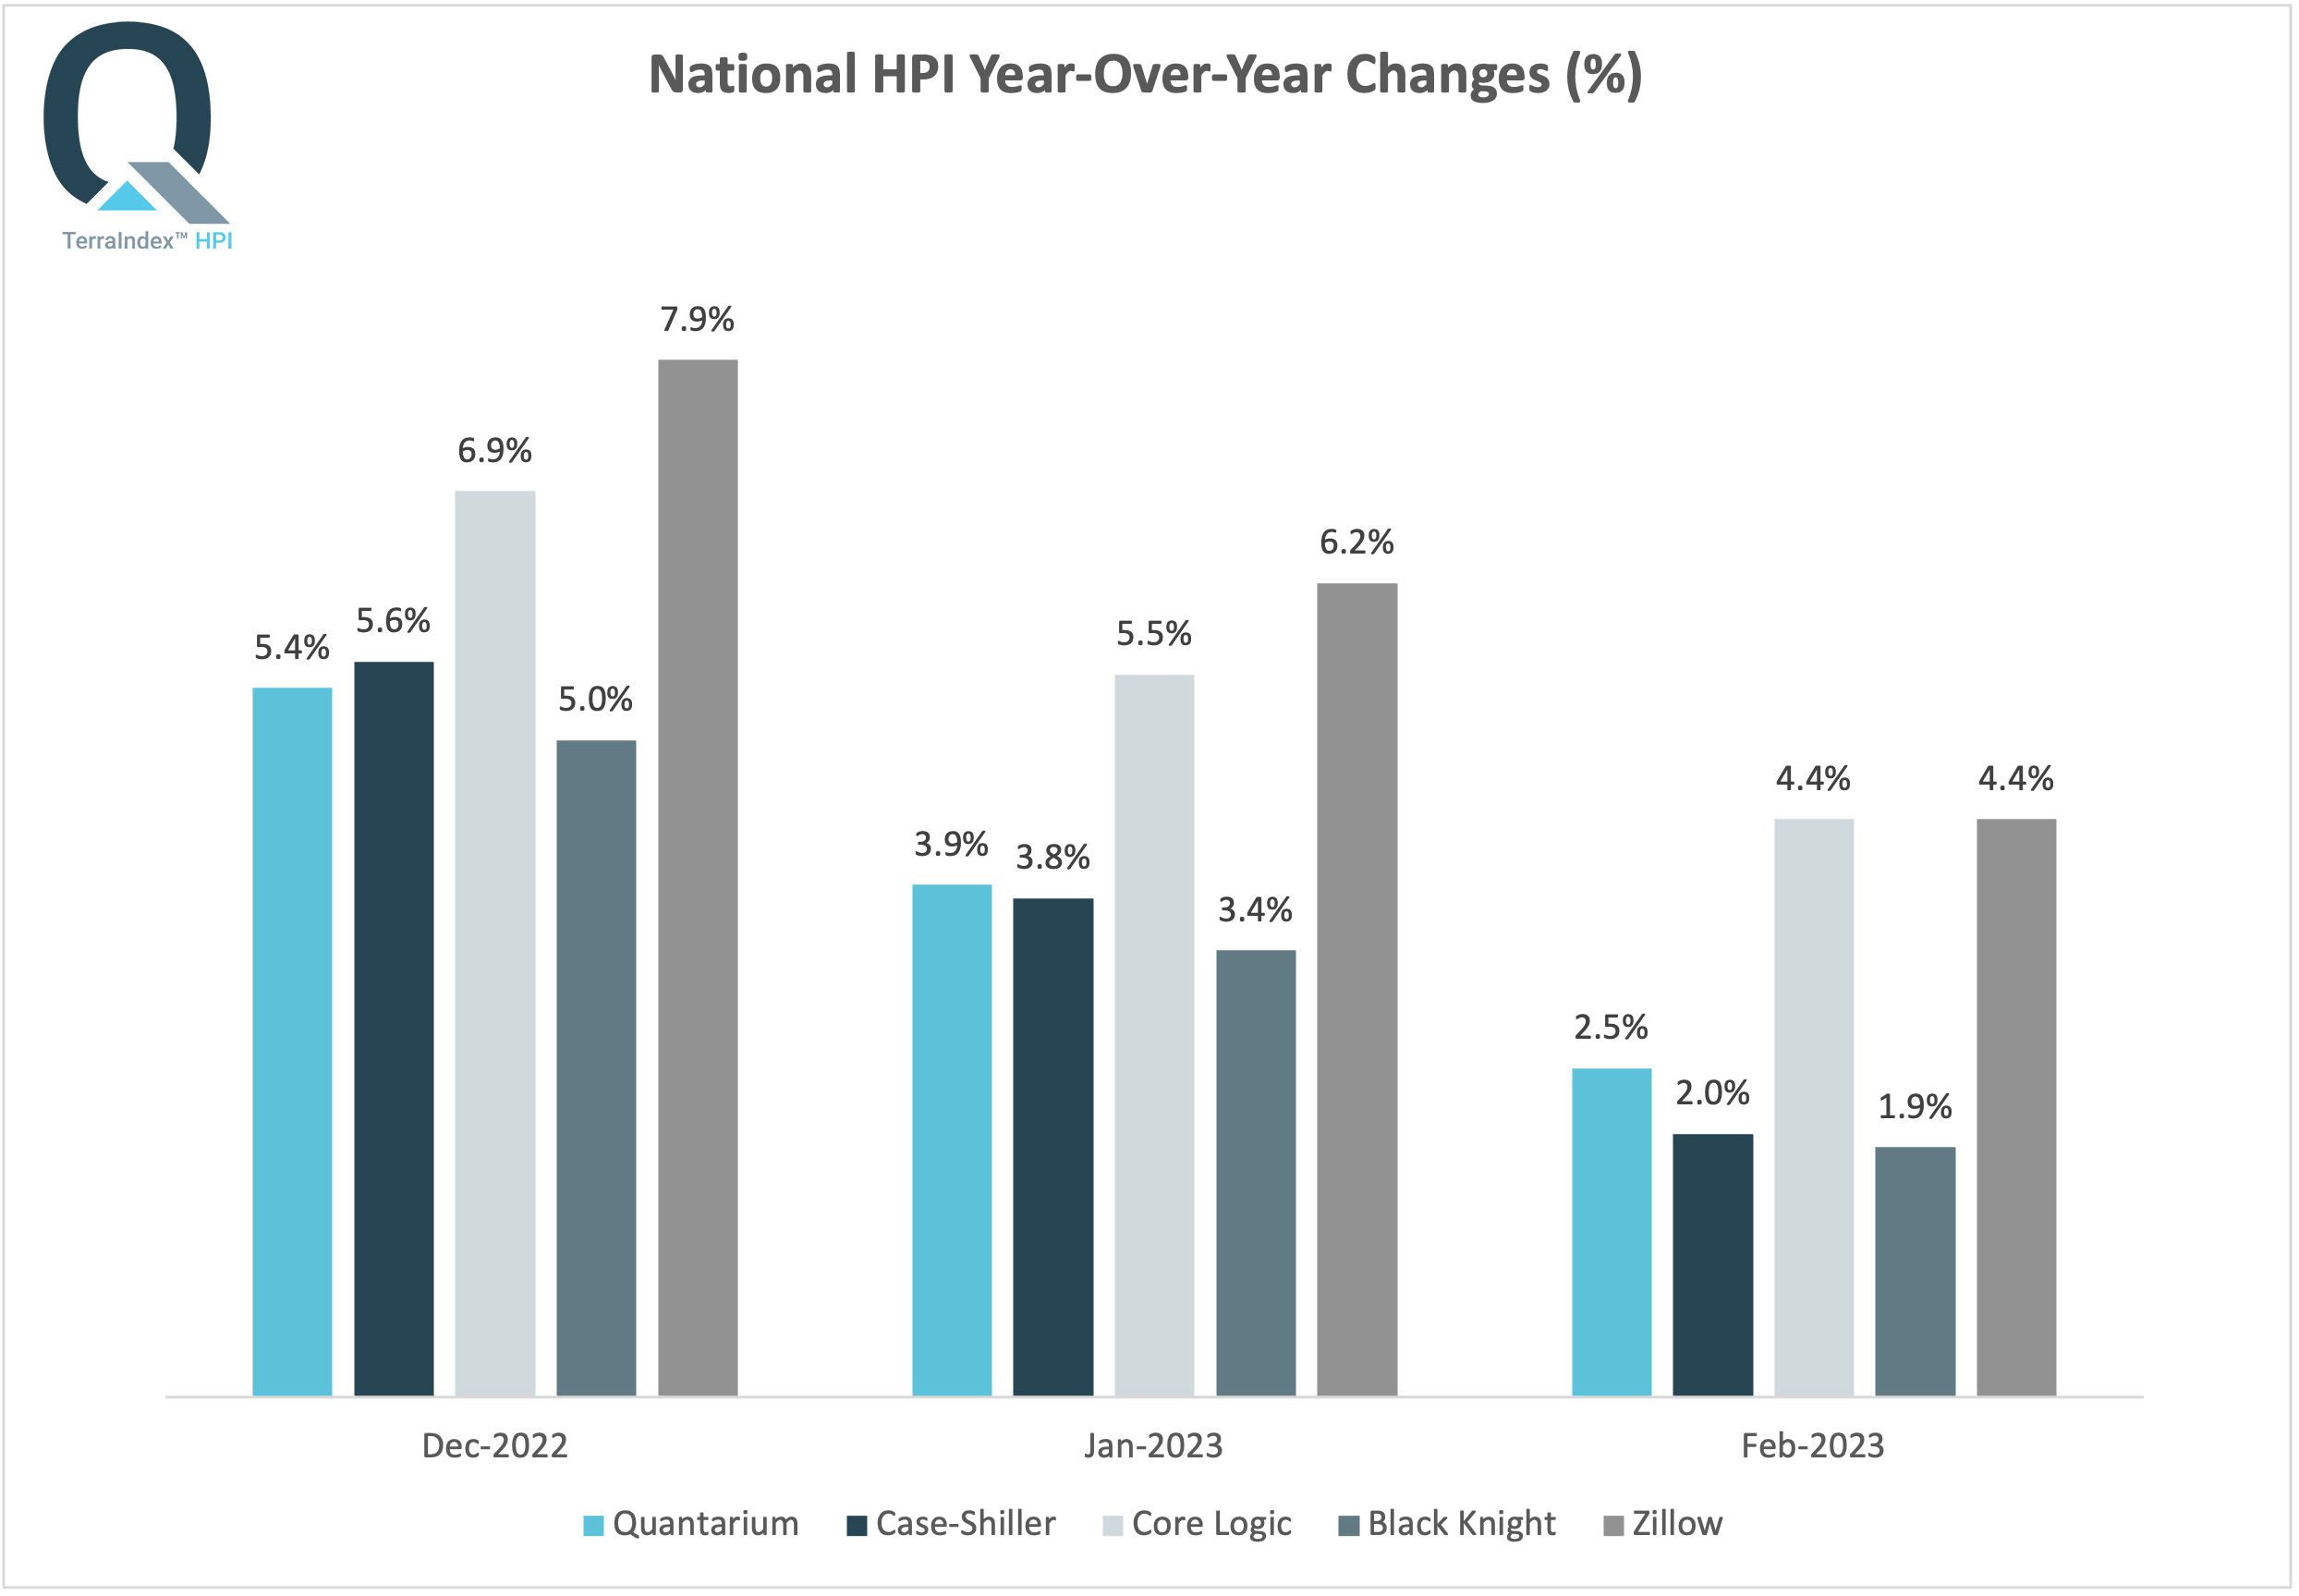
As the data table and the chart below illustrate, all five national home price indices are showing a similar pattern, namely that prices are increasing at a slower and slower rate each month since December 2022. Quantarium, Case–Shiller and Black Knight show somewhat similar results in the rate of national price changes each month.

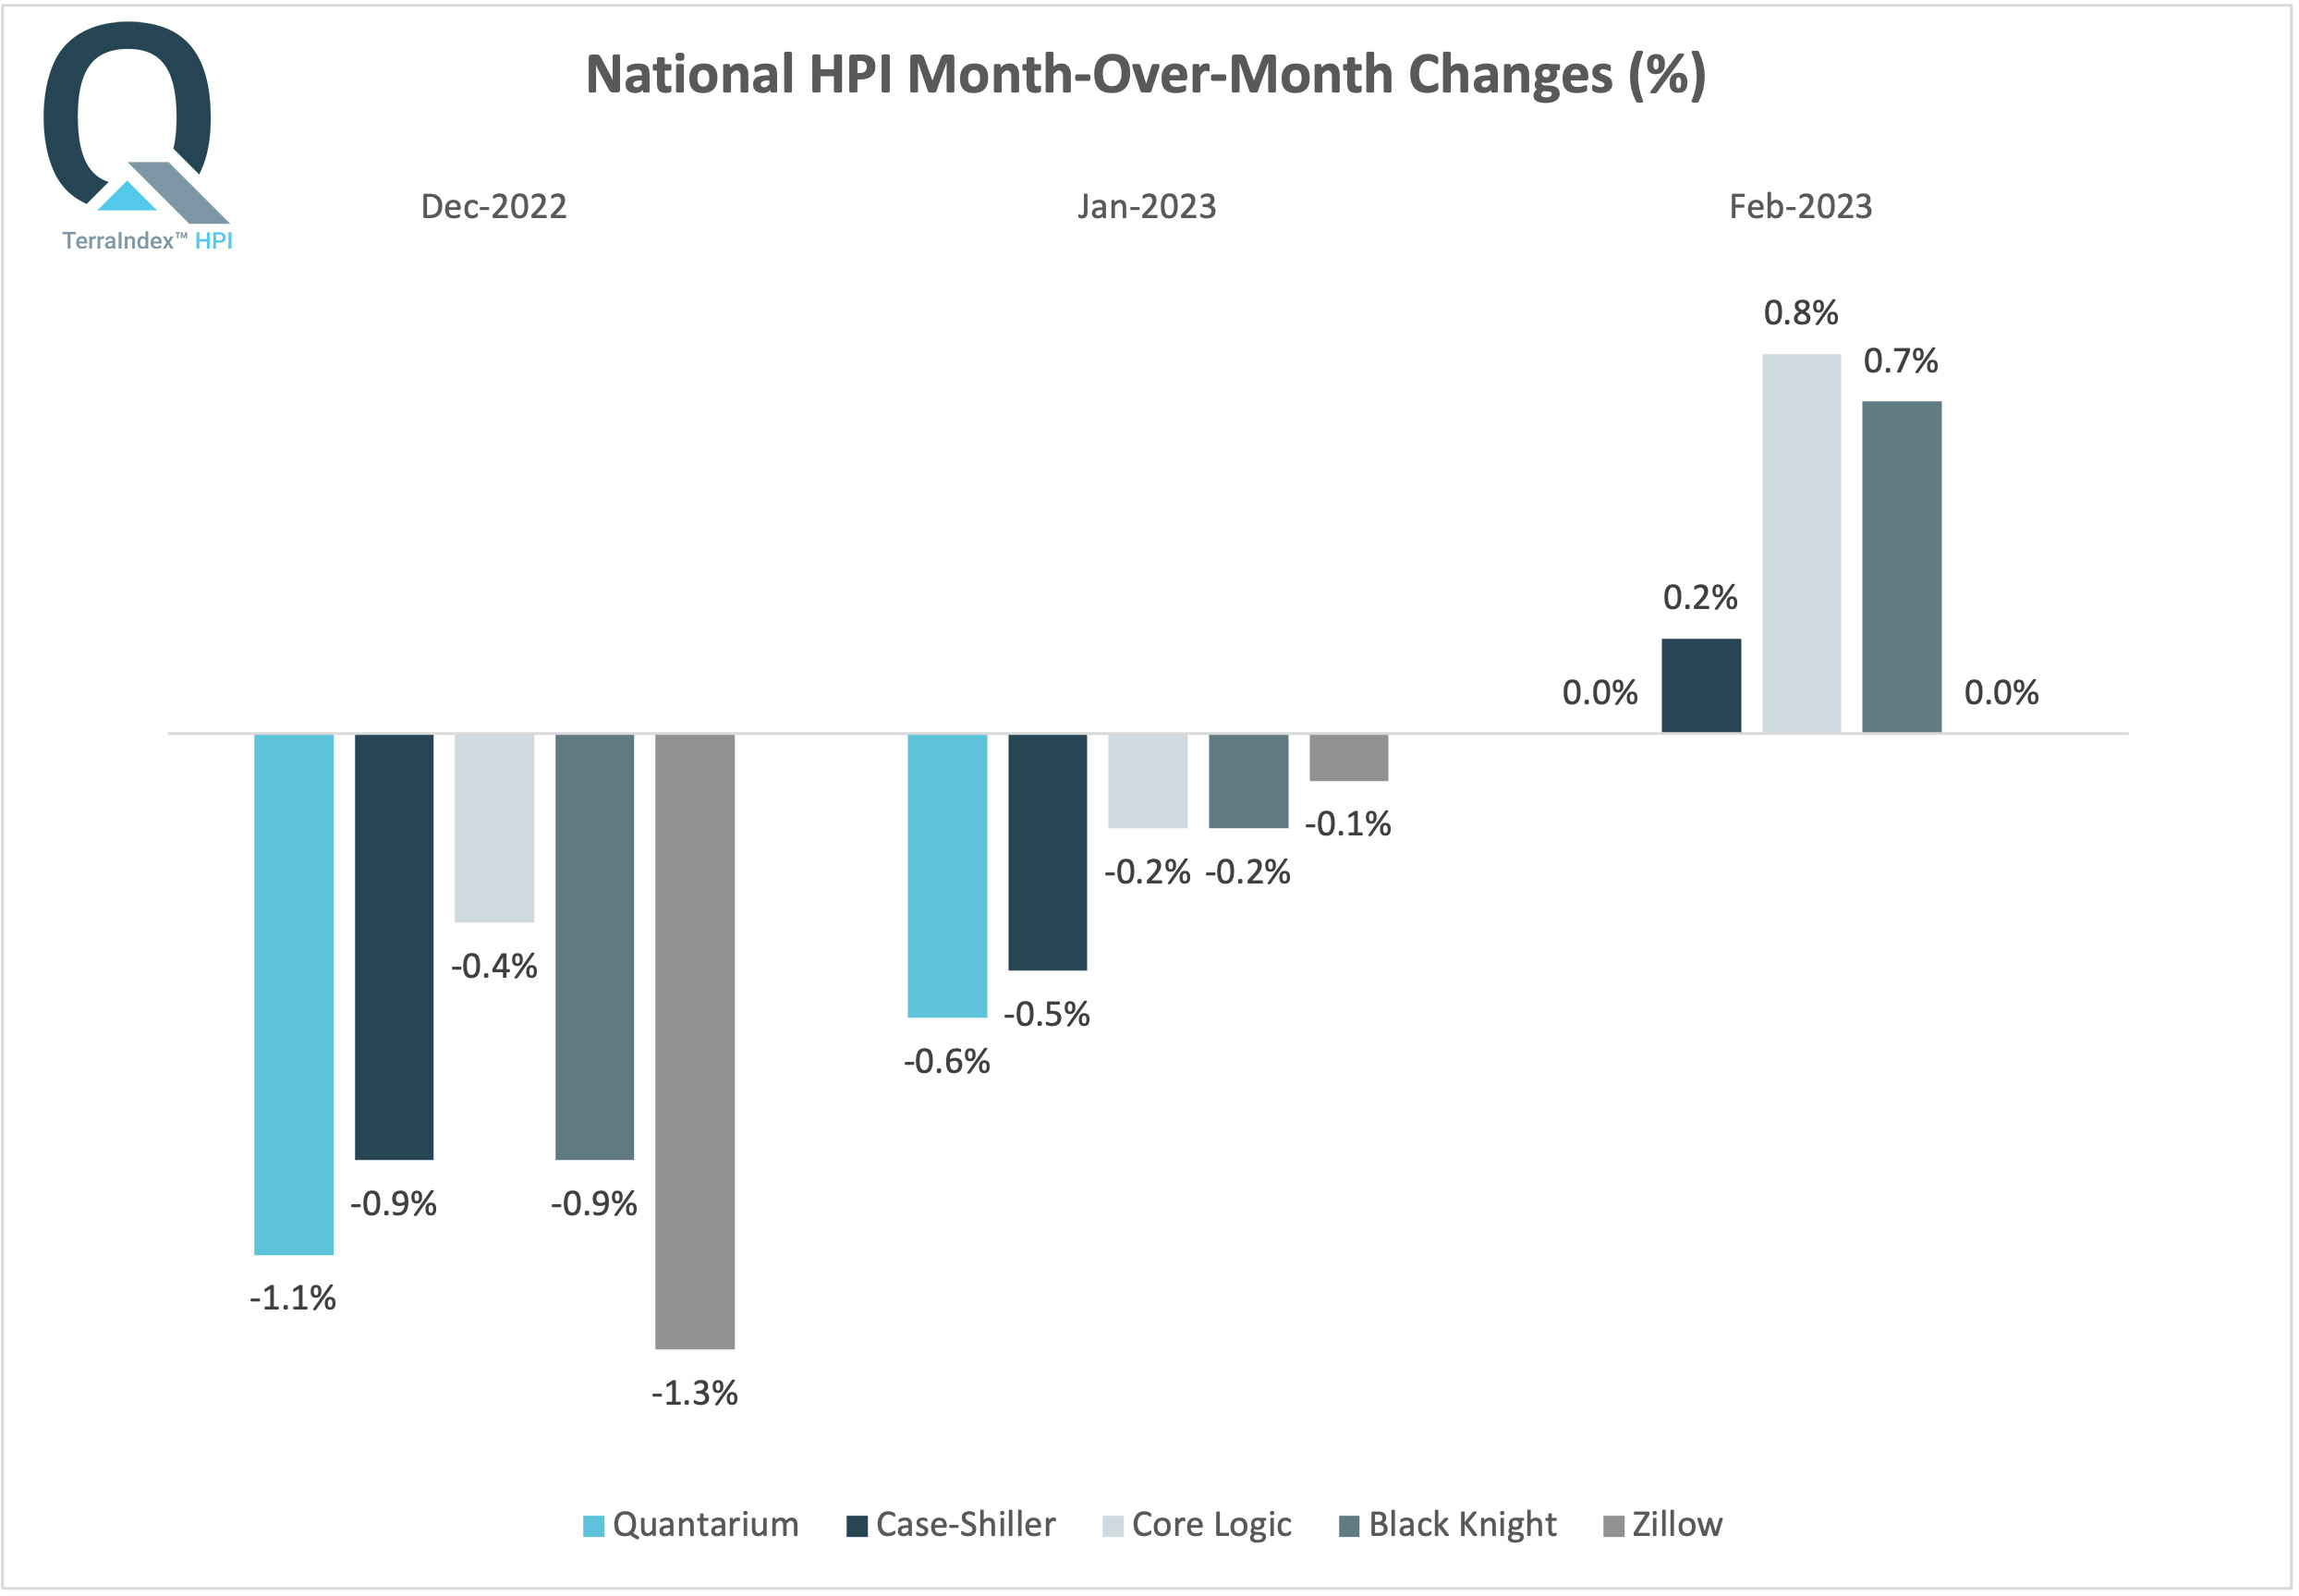
On a non-seasonally-adjusted month-over-month basis, all five HPI providers are capturing the market shift that happened from January to February 2023, when home prices broke the depreciation trend that started in the summer of 2022 – see the chart below. Quantarium’s month-over-month HPIs seem to be somewhat closer to Case-Shiller for the three months combined.

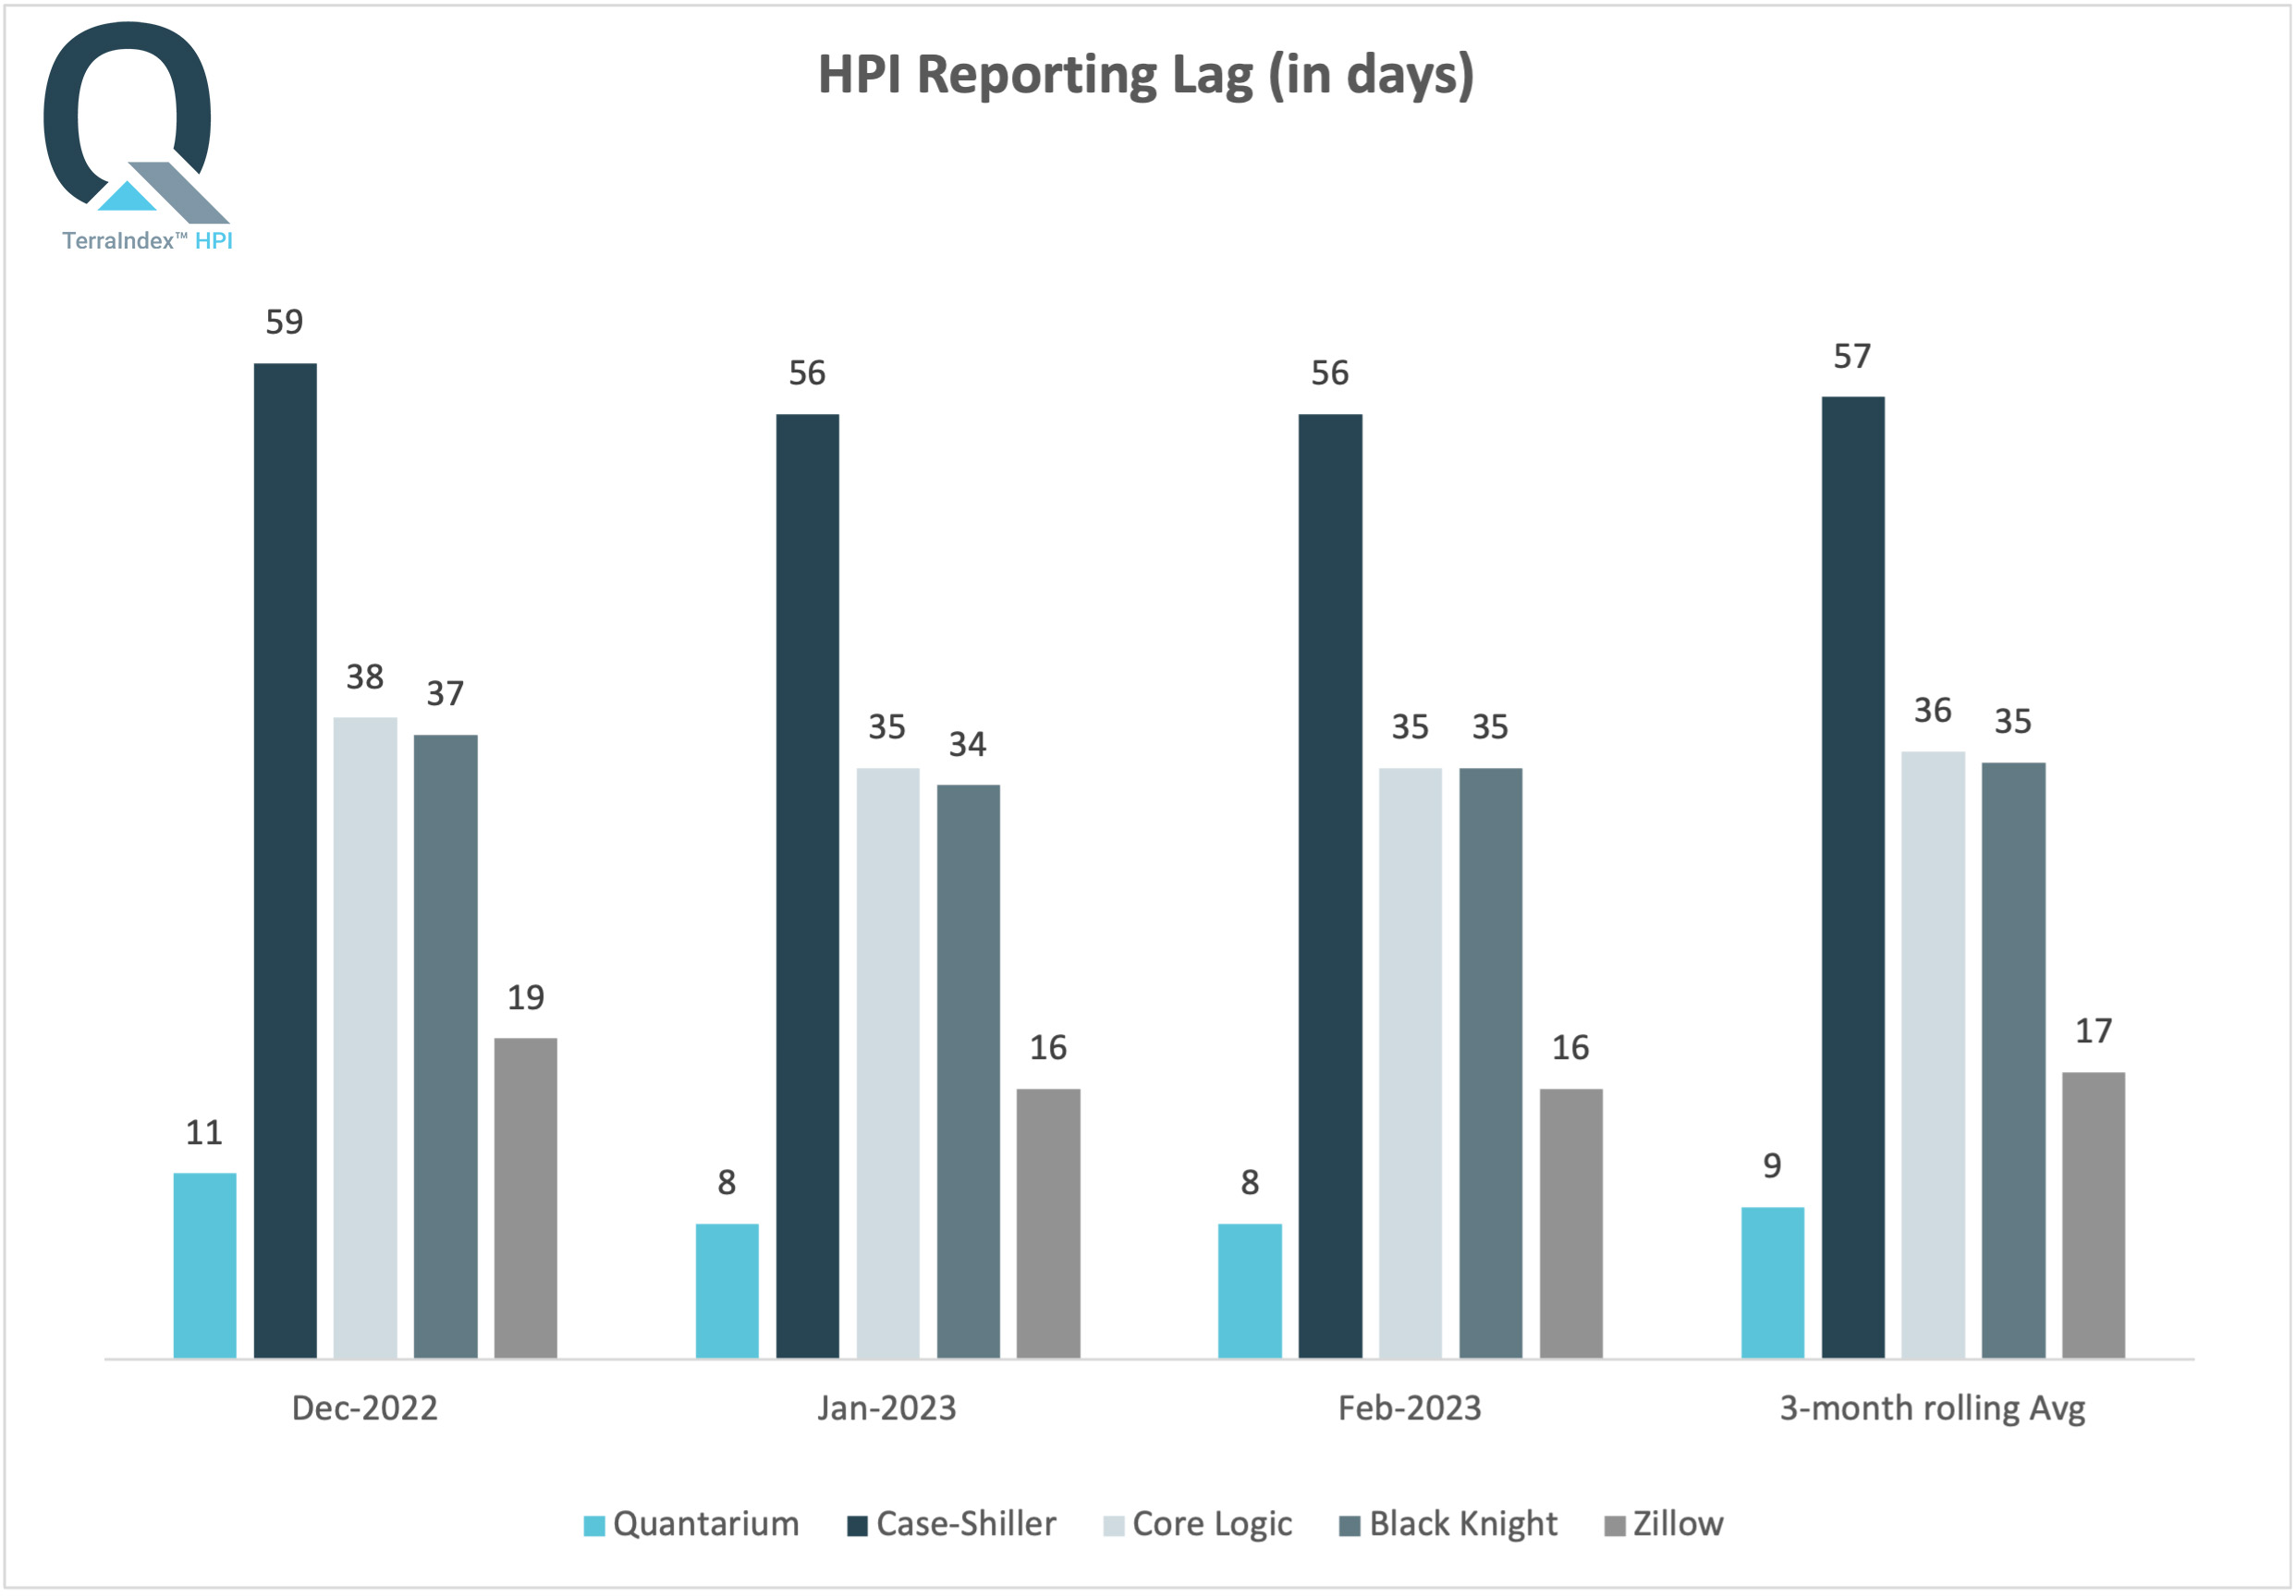
But, while the general trends are similar, the reporting date for indices each month is substantially different. For example, in reporting its December 2022 results, Case-Shiller waited until February 28, 2023 – a full two months after the close of December – to issue its report. For the same month, Quantarium issued its report on January 11, 2023, just 11 days after the close of the month. These detailed differences for the three months analyzed in this report are illustrated in the chart below. In fact, Quantarium’s three-month rolling average time lag is nine days. The average monthly time lag for a full year is expected to be around ten days.

Data Sources Used In This Report
For Quantarium HPI data – see corresponding monthly report from https://www.quantarium.com/terraindex-reports/. For example, the HPI data for the month of December 2022 can be reviewed from https://www.quantarium.com/terraindex-report-december-2022/.
For Case-Shiller HPI data – see https://www.spglobal.com/spdji/en/indices/indicators/sp-corelogic-case-shiller-us-national-home-price-nsa-index/#overview.
For CoreLogic HPI data – see the corresponding monthly report from https://www.corelogic.com/category/intelligence/reports/home-price-insights/. For example, the HPI data for the month of December 2022 can be reviewed from https://www.corelogic.com/intelligence/u-s-home-price-insights-february-2023/.
For Black Knight HPI data – see the corresponding monthly report from https://www.blackknightinc.com/data-reports/?report-type=mortgage-monitor&. For example, the HPI data for the month December 2022 can be reviewed on page 14 of the following PDF – https://www.blackknightinc.com/wp-content/uploads/2023/02/BKI_MM_Dec2022_Report.pdf?.
For Zillow HPI data – see https://www.zillow.com/home-values/102001/united-states/.
About TerraIndex™ HPI
The TerraIndex™ Home Price Index (HPI) is based on the proprietary Quantarium Valuation Model (QVM) value estimates for more than 100 million residential U.S. homes. QVM has been tested extensively in the last five years by some of the most trusted third-party AVM testing agencies in the U.S. and has been consistently ranked at the top for both Accuracy and Hit Rate performance metrics. QVM was also recently approved by Fitch Ratings for Wall Street transactions. You can read the announcement here.
According to John Smintina, Ph.D., Chief Analytics Officer and Quantarium Co-Founder, Quantarium can report results sooner than other indices because QVM re-computes the estimated values for the entire national footprint on a weekly basis, along with HPIs at various geography levels – from State, County, CBSA, down to Zip Code and Census Tract. Furthermore, the HPIs produced on a given date are based on proprietary valuation models which include over 90% of all sales transactions that will have been eventually reported through a four-week rolling period ending that date, taking advantage of Quantarium’s industry-leading Data Services Platform (QDSP) to reduce the processing time lag to an absolute minimum. That allows TerraIndex™ HPI to provide the most current market insights, being weeks faster than most other housing indices in the U.S.
The report for a given month is usually available on the second Wednesday of the following month. For example, HPIs for the month of April 2023 will be released on Wednesday, May 10.
About Quantarium
Located in Bellevue, WA, Quantarium was founded by a team of leading scientists and Ph.D.’s. The company has designed and developed an innovative and enabling set of AI and Visual Technologies currently being deployed across multiple real estate industry sectors. Quantarium is one of the most accurate sources of property insights for over 158 million U.S. properties and trusted by major mortgage lenders, financial institutes, builders, direct marketing agencies, and real estate professionals across the nation. With a technology suite that is different in kind, then degree, the company’s products and services uncover and capitalize on the core DNA of vertical industries. From genetic modeling property valuations and markets that understand and interpret real estate data as expressed through synthetic future populations, through to CV adjusted values, Quantarium offers real AI to drive real value.
For more information, visit quantarium.com.
Business Inquiries for Quantarium:
+1 424 210 8847
discover@quantarium.com
Media Inquiries for Quantarium:
Romi Mahajan | KKM Group
+1 425 591 7664
romi@thekkmgroup.com
