Key Insights At National Level

Nationwide, home values for combined single-family detached and single-family attached properties increased by 2.5% in February 2023 from February 2022. This is the lowest year-over-year increase in more than 10 years (since August 2012).
Month-over-month (non-seasonally adjusted) home values were basically flat in February 2023 from January 2023. This is the first month without a meaningful price depreciation since the market peak in June 2022. However, this trend might not continue, likely due to higher interest rates compared to last month.
Home values nationwide are still down by 5.5% through the end of February 2023 compared to their June 2022 market peak.
Key Insights At State Level

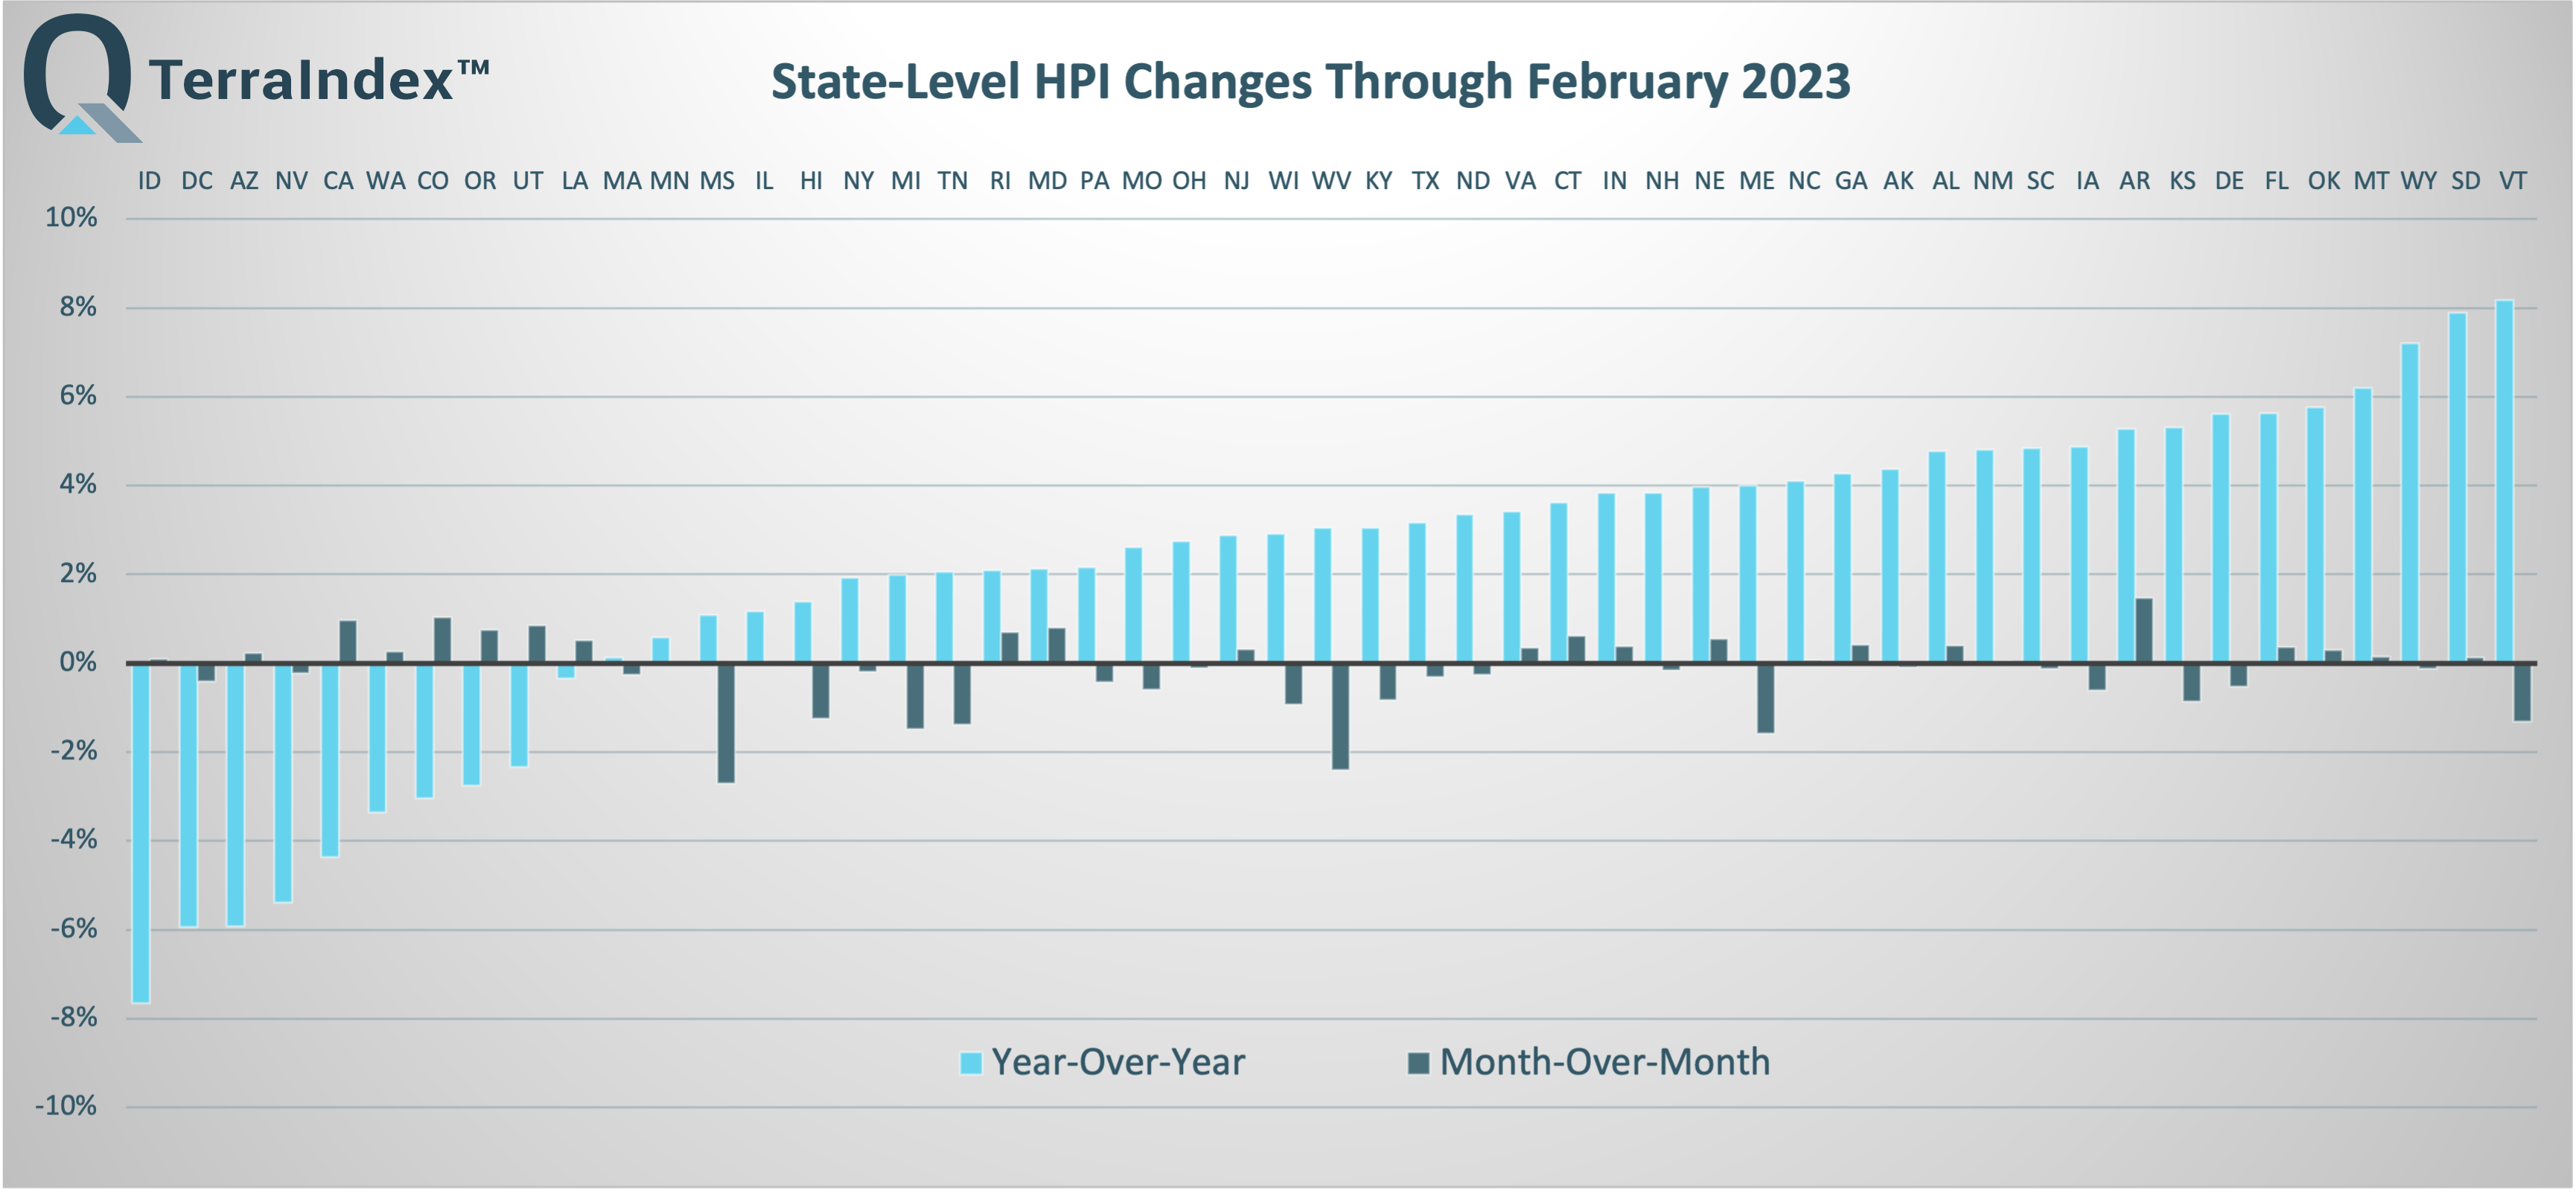
On a year-over-year basis, there still are 9 states and the District of Columbia that have seen an annual decline in home values at the end of February 2023. Idaho continues its steep downward trajectory, now at -7.7%, followed by Washington DC, Arizona, Nevada, California, Washington, Colorado, Oregon, Utah and Louisiana. Florida, at +5.6%, continues to slip away from the top year-over-year performers, impacted by its outsized growth rates from a year ago.
On a month-over-month basis (non-seasonally adjusted), we are seeing a bounce back of some Western states that have fallen the most in the last year. Colorado, California, Utah, and Oregon have all recorded month-over-month price increases between 0.7% and 1%. At the other end, there are some states in the positive year-over-year territory that have fallen more than 1% in the last month, which could be a sign of a more balanced geography of home value dynamics going forward.
Since the June 2022 market peak, Idaho continues to register the largest price drop, around -15%. All states except South Dakota and Arkansas are in negative territory compared to the June 2022 peak. About half of the U.S. states have seen positive price changes in the last month. More transaction data is needed to see if this is a new emerging market trend, or it’s simply driven by seasonality. Of course, interest rates dynamics will also play a key role in this outcome.
Top 50 CBSA Markets

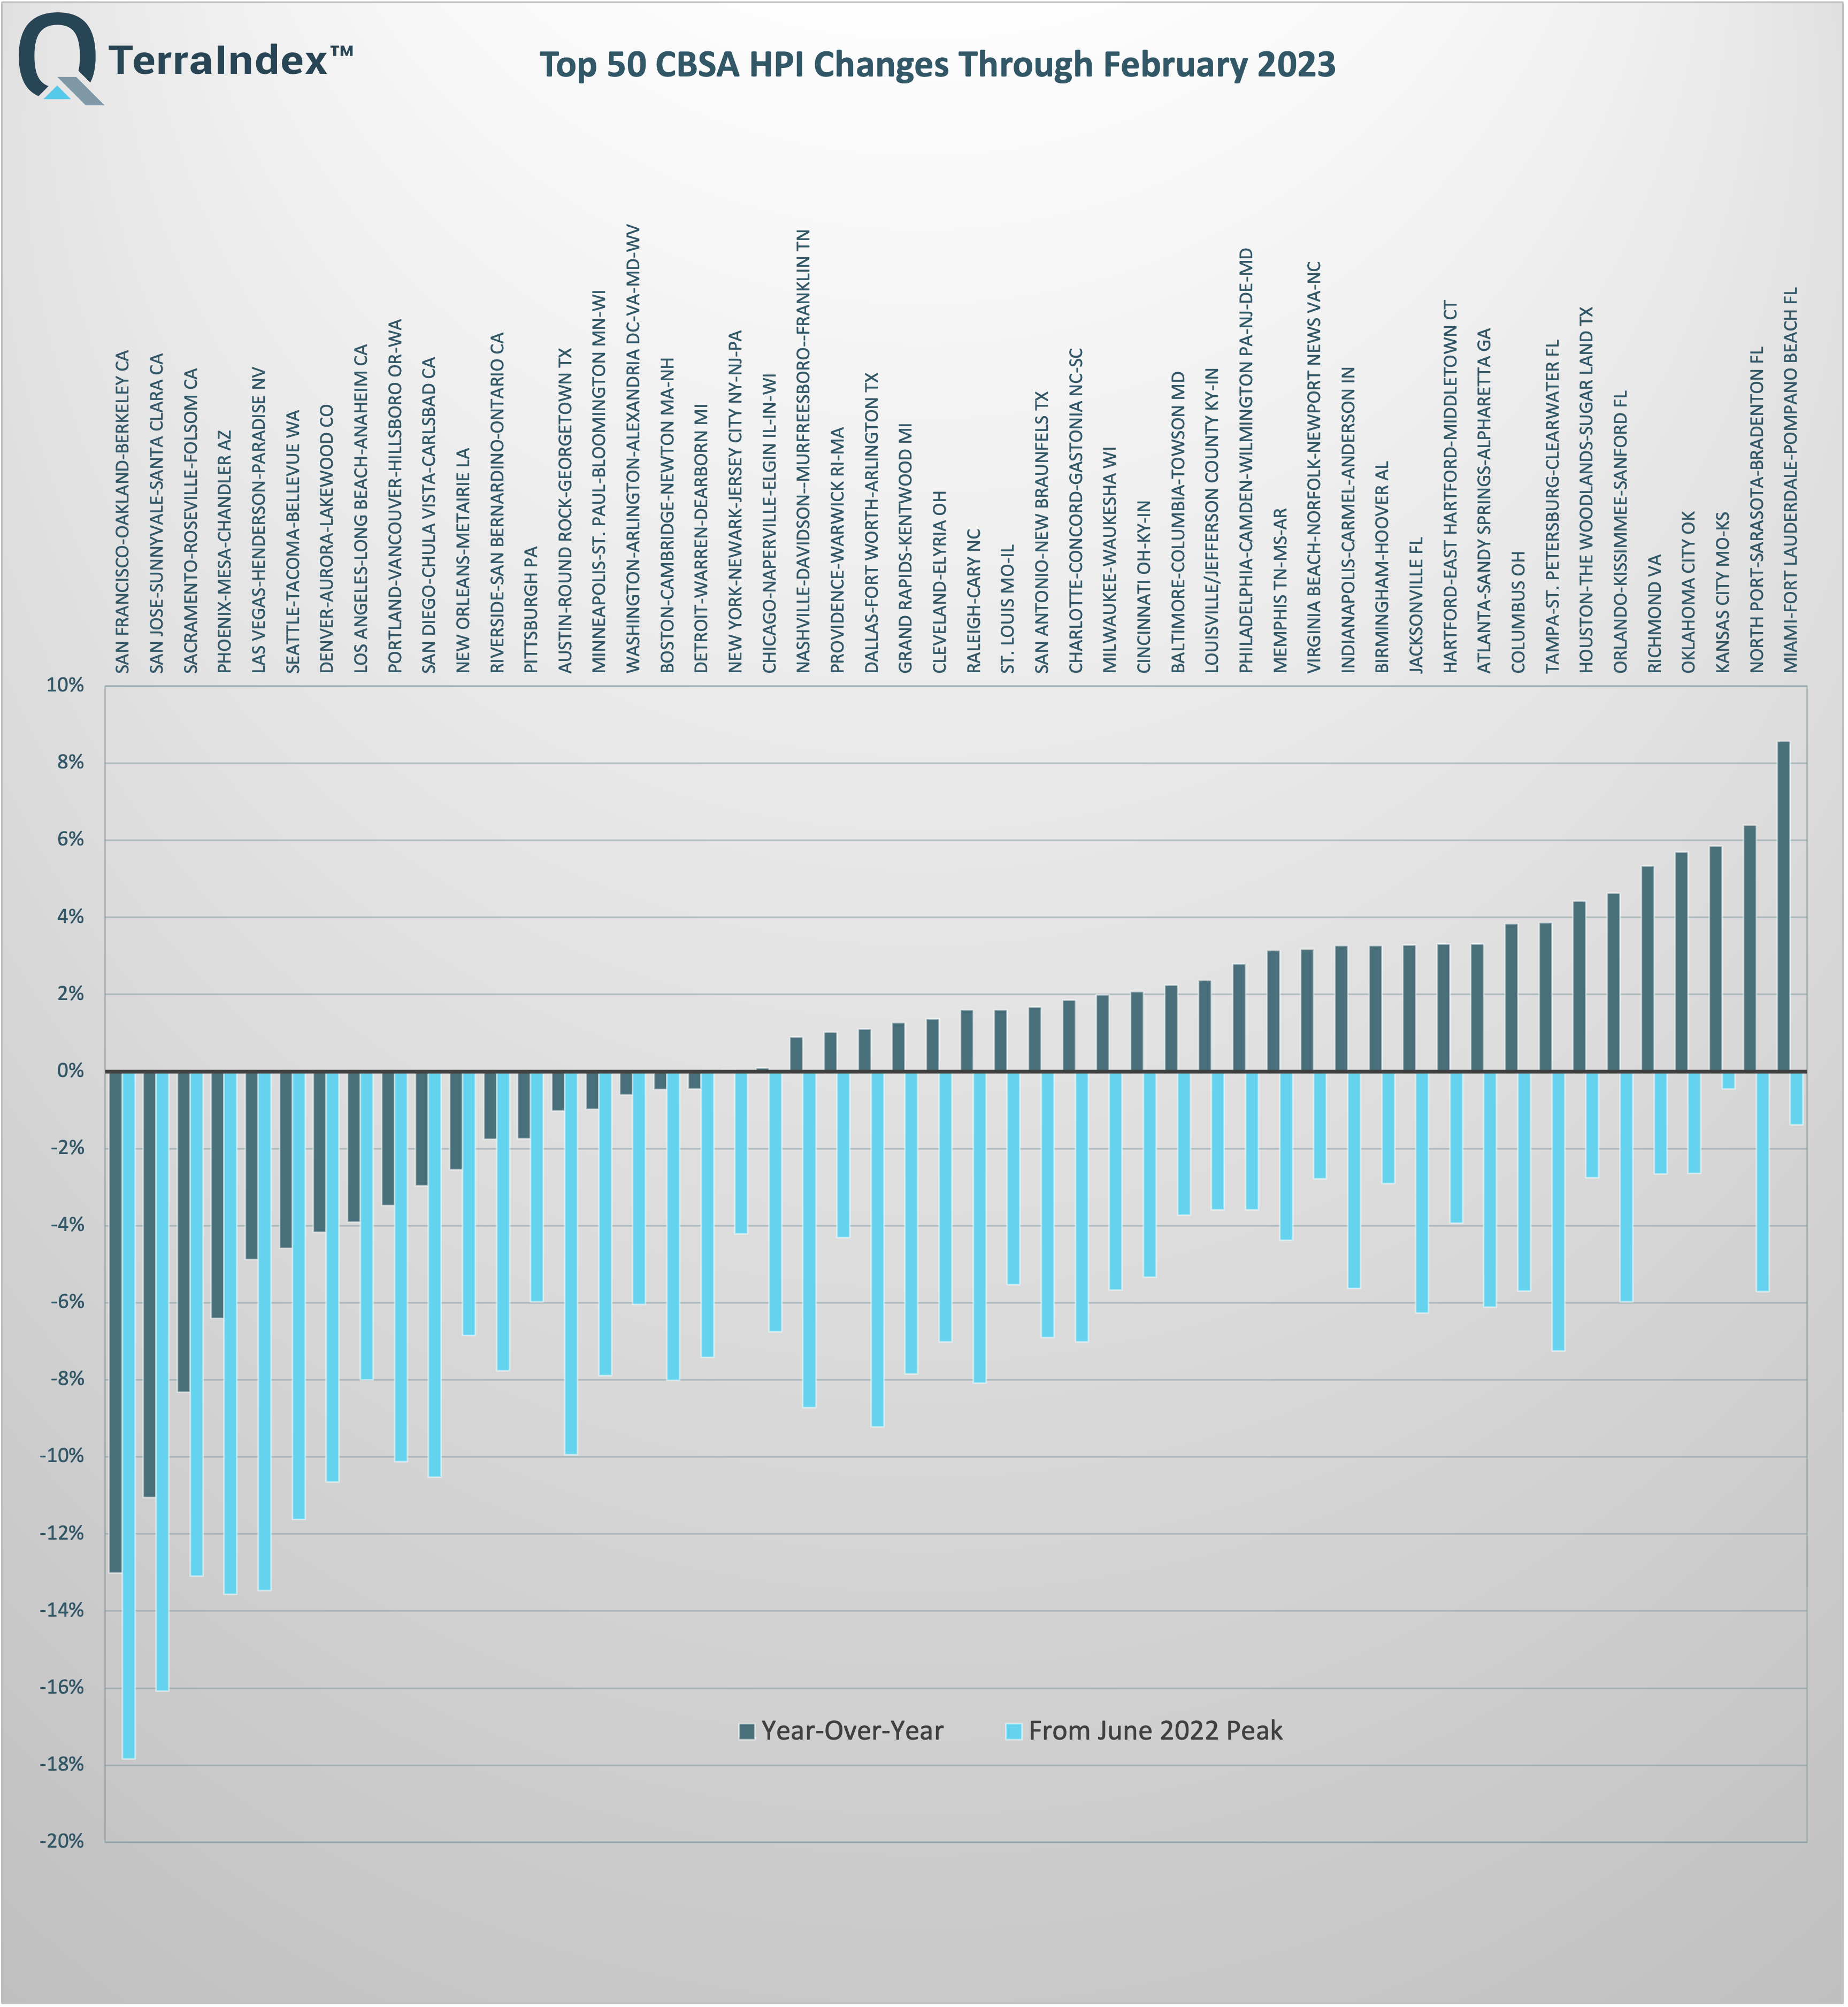
On a year-over-year basis, 18 out of the top 50 CBSA markets are in negative territory. San Francisco (CA) and San Jose (CA) are leading the pack, with price depreciations of more than -10%, followed by Sacramento (CA), Phoenix (AZ), Las Vegas (NV), Seattle (WA), Denver (CO), Los Angeles (CA), Portland (OR) and San Diego (CA). At the other end, Miami (FL) continues to record the highest year-over-year price growth of 8.6%, but that’s a long way from the +31.3% high mark recorded not even a year ago (in May 2022).
Since the June 2022 market peak, all top 50 markets are still in negative territory at the end of February 2023. The top decliners include primarily the same markets mentioned in the year-over-year stats referenced above, with Austin (TX) joining the top-10 group.
Over the last month, it’s interesting to note that some of the major Western markets have seen some meaningful price appreciation for the first time since the June 2022 market peak. On a month-over-month basis (non-seasonally adjusted), San Francisco (CA) and San Jose (CA) were up more than 1%, while Denver (CO), Los Angeles (CA), San Diego (CA), Seattle (WA) and Portland (OR) have seen price increases between 0.7% and 1%.
Why TerraIndex™ HPI
Our Home Price Index (HPI) is based on the proprietary Quantarium Valuation Model (QVM) value estimates for more than 100 million residential U.S. homes. QVM has been tested extensively in the last 5 years by some of the top third-party AVM testing agencies in the U.S. and has been consistently ranked at the top for both Accuracy and Hit Rate performance metrics. QVM re-computes the estimated values for the entire national footprint on a weekly basis, along with HPIs at various geography levels – from State, County, CBSA down to Zip Code. That allows TerraIndex™ HPI to provide the most current market insights, being weeks faster than most other housing indices in the U.S.
The report for a given month is usually available on the second Wednesday of the following month, for example HPIs for the month of December 2022 were made available on Wednesday, January 11, 2023.
About Quantarium
Located in Bellevue, WA, Quantarium was founded by a team of leading scientists and Ph.D.’s. The company has designed and developed an innovative and enabling set of AI and Visual Technologies currently being deployed across multiple real estate industry sectors. Quantarium is one of the most accurate sources of property insights for over 158 million U.S. properties and trusted by major mortgage lenders, financial institutes, builders, direct marketing agencies, and real estate professionals across the nation. With a technology suite that is different in kind, then degree, the company’s products and services uncover and capitalize on the core DNA of vertical industries. From genetic modeling property valuations and markets that understand and interpret real estate data as expressed through synthetic future populations, through to CV adjusted values, Quantarium offers real AI to drive real value.
For business inquiries, please contact us at 424.210.8847 or discover@quantarium.com.


